比特币平均出块时间为10分钟。然而若在某一固定时间点进行观测(如每天12点整),则两个块的时间间隔预期却为20分钟。
本文为转载,原作者:Russell O’Connor
原文地址
Why Is It Taking 20 Minutes to Mine This Bitcoin Block?
2018-02-25T16:05:48Z
Does this sound familiar?
You have just made a Bitcoin transaction and you are eager to see if it appears in the next block. You know that the expected time between Bitcoin blocks is 10 minutes. You check the log of your Bitcoin node. It has been 7 minutes since the previous block. You recall that blocks occurrences in Bitcoin are a Poisson process, which is memoryless. Even though it has been 7 minutes since the previous block, you still expect to wait another 10 minutes.
Five minutes pass. No new blocks have appeared. You have been staring at your Bitcoin node’s log this entire time. It has now been 12 minutes since the previous block. All your waiting has not changed anything. Even though you have been waiting for 5 minutes, the math says that you are still expected to wait 10 minutes before the next block will appear. A Poisson process is memoryless.
After staring at your Bitcoin node’s log for a further 8 minutes, you finally see a new block. “I swear that this always happens to me,” you say to yourself. “Whenever I’m waiting for my transaction to be confirmed, it always seems that the particular block I’m waiting for takes like 20 minutes to mine.”
My friend, if this has happened to you, you are not alone. This phenomenon is real.
Under the simplifying assumption that Bitcoin’s hashrate is constant, we know that a new block is mined once every 10 minutes on average, and this mining process can be well modeled by a Poisson process. Because Poisson processes are memoryless, at any given time we always expect that the next block will appear, on average, in 10 minutes. This holds no matter how long we have already been waiting. This memorylessness property applies just as well backwards in time as it does forwards in time. That is, if you pick a random point in time, on average, the previous block will have been mined 10 minutes earlier.
This is clear because if you sample a series of events from a Poisson process and take a second sample and reverse the occurrences of that series of events, the two samples will be indistinguishable. Therefore, by this symmetry, it must be the case that when you pick a random point in time, the expected time until the next event is the same as the expected time since the previous event.
“Wait a minute. You are saying that, if I pick a random point in time, we expect the previous block to have been mined 10 minutes in the past, and we expect that the next block will be mined 10 minutes in the future. Doesn’t that mean that we expect a total of 20 minutes between blocks?”
Correct, that is exactly what I am saying. If you pick a random point in time, you expect 20 minutes between the previous block and the next block on average.
“That cannot be true because we know that there are, on average, 10 minutes between blocks, not 20 minutes.”
This apparent paradox is essentially the same as the hitchhiker’s paradox. To resolve this paradox we need to understand that the question, “What is the expected time between blocks?” is underspecified. To compute an expected value we need to know which distribution we are computing the expected value with respect to.
Suppose we observe the Bitcoin blockchain for a while, and we make a list of the time between each successive block. When we average this list of numbers, we will get a value that is close to 10 minutes. Averaging this way corresponds to a distribution where each block interval is sampled with equal probability.
More precisely, the pdf for this distribution of non-negative interval durations is the exponential distribution \(\text{pdf}_\text{1}(t) = N_1 e^{-\lambda t}\), where \(\lambda\) is \(0.1\ \text{min}^{-1}\), Bitcoin’s block rate, and where \(N_1\) is a normalization constant (which in this case is also \(0.1\ \text{min}^{-1}\)). The expected value of this distribution is \(\int{t\ \text{pdf} _\text{1}(t)\ dt} = 10\ \text{min}\).
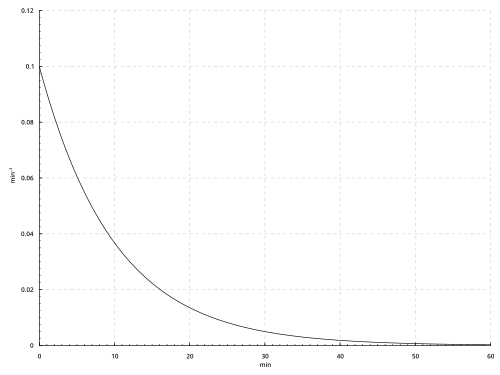
pdf1: exponential distribution
Suppose we observe the Bitcoin blockchain for a while, and every day we write down the duration of the block whose interval crosses the 9:00 am mark. When we average this list of numbers, we will get a value that is close to 20 minutes. Averaging this way corresponds to a distribution where each block interval is sampled, not with equal probability, but proportional to how long the interval lasts. For example, we are twice as likely to sample an interval that lasts for 14 minutes than we are to sample an interval that lasts for 7 minutes simply by virtue of the fact that 14 minute intervals last twice as long as 7 minute intervals.
We can take the pdf for the exponential distribution above and multiply it by a linear factor to reweight the probabilities in accordance with how long the interval is. After normalization, the resulting pdf for this distribution is the gamma distribution (which shape parameter 2) $\text{pdf}_\text{2}(t) = N_2\ t\ e^{-\lambda t}$ (whose normalization constant $N_2$ is $0.01\ \text{min}^{-2}$). The expected value of this distribution is $\int{t\ \text{pdf}_\text{2}(t)\ dt} = 20\ \text{min}$.
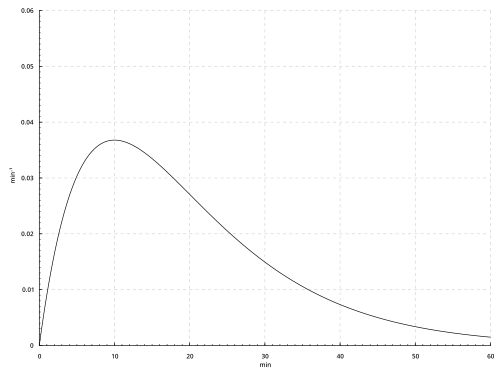
pdf2: gamma distribution with shape parameter 2
We can double-check this result by recalling the time reversing symmetry argument above. When we pick a random point in time, the time until the next block is some random variable X whose pdf is pdf1, and the time since the previous block is a random variable Y whose pdf is also pdf1. Therefore, the total time between the last block and the next block is the random value X + Y. We can compute the distribution for this sum by taking the convolution of pdf1 with itself, and we indeed get pdf2 as a result.
The bias towards picking longer blocks intervals by using the second sampling method accounts for the discrepancy between the two different results when computing average block interval durations. However, the word “bias” is not meant to be pejorative. This other sampling method is not incorrect or with prejudice; it is simply a different way of sampling. The distribution of intervals you need to use depends on the application you are using it for. If you want to compute the throughput of the Bitcoin, you will need to use the exponential distribution. If you want to know “why is does it take 20 minutes to mine the Bitcoin block with my transaction in it?”, you need to use this gamma distribution.
转载请注明来源,欢迎对文章中的引用来源进行考证,欢迎指出任何有错误或不够清晰的表达。